
How to Use Twitter’s Newly Opened Analytics to Find Great Blogging Ideas
Twitter announced (somewhat quietly) recently thatTwitter Analytics are now open to everyone.
This simple tool makes Twitter much more valuable to people who create and publish things online. Here’s how.
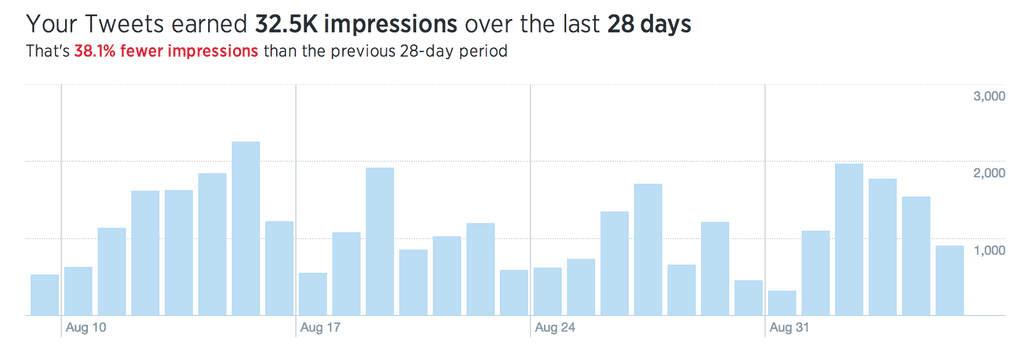
If you’re logged in to Twitter, just visit analytics.twitter.com. You’ll see a bunch of interesting data on this page, including the following:
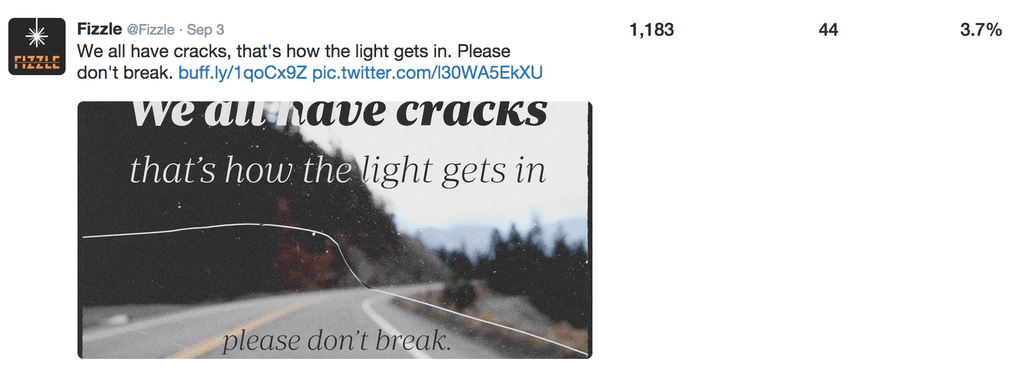
Then, below that graph, you’ll get a chronological listing of your tweets, including numbers for impressions, engagement and engagement rate:
If you click on an individual tweet, you’ll see the following expanded stats:
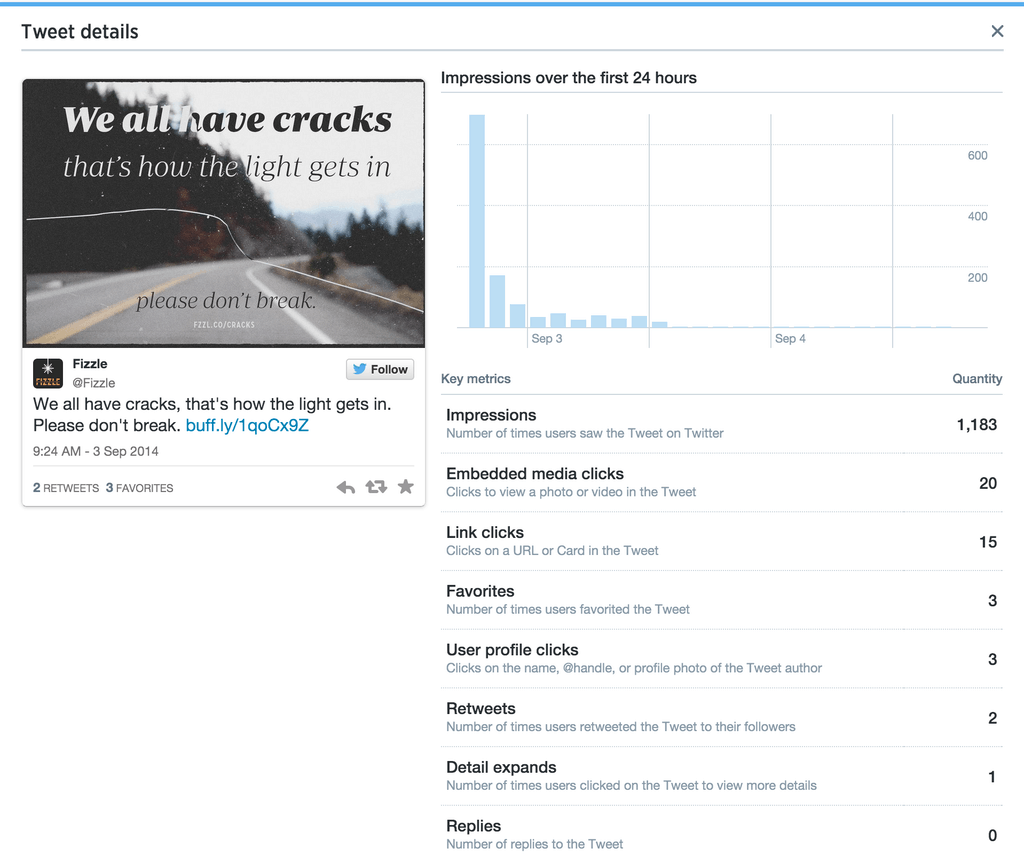
This detail hasn’t been available before, and it’s gold.
The big-picture account stats are interesting, but the real value is in the individual tweet stats. Now you can use Twitter to find great headline and content ideas, for blogging, videos, etc.
For example, we can see from the tweet above (posted from the @Fizzle account), that 42 people engaged with the tweet.
Twitter defines engagement as this:
“Total number of times a user has interacted with a Tweet. This includes all clicks anywhere on the Tweet (including hashtags, links, avatar, username, and Tweet expansion), retweets, replies, follows, and favorites.”
This goes beyond just favorites and retweets. When someone clicks a link or avatar or expands the tweet, that counts as well, along with replies and follows from a tweet. This is a great measure of how interested people are in any particular tweet.
Now, don’t worry about the absolute numbers, or about comparing your account to other accounts. I’m not even sure if Twitter’s analytics count activity through tools like Tweetbot as well, but it doesn’t matter.
What we care about is relative performance, between tweets of similar types, from the same account.
The value here is that we can quickly see how people react to different headlines, ideas, quotes, images, etc.
For example, check out the numbers on this next tweet (click on the image to see the original tweet):

This is from the same @fizzle account. Now we see that people weren’t really interested in the idea of “get on the list to get it in your inbox every tuesday.” That tells us something interesting.
We also know that the following tweet got a much higher response, with 122 total “engagements:”

These stats are all cues about what your followers (and their followers, from retweets) are most interested in.
You might already know some of this, from comments and shares on your own content, but the real value comes from being able to see engagement stats on ideas and thoughts and quotes, and when you share content from other sites. This is where your ideas will come from. More on that in a minute.
Here are a couple of other interesting observations from our data (this is data from our specific account, so your mileage may vary):
- Tweets with images have 93% more impressions on average than tweets without images (not counting reply tweets)
- Wednesday and Saturday had the lowest average impressions per tweet, with 12.6% and 11.1% fewer impressions than average, respectively. Sunday and Thursday had the highest, at 15.4% and 12.7% more impressions than average.
Note that you can export your stats as a CSV file, and pull them into a spreadsheet. The exported stats contain details like number of retweets, replies, favorites, profile clicks, url clicks and much more, on a per-tweet basis.
Now, here’s how to find ideas from your Twitter analytics data.
Writing entire blog posts to test ideas and see how people react takes hours. You can short-circuit this process by posting tweets on different ideas first. Then take the most engaged tweets and turn them into blog posts, videos, etc.
For example, this tweet received 10,377 impressions, which is far higher than average for this account:
"Don’t worry about the money. Love the process." – Joan Rivers— Fizzle (@Fizzle) September 8, 2014The concept + quote from that tweet could make a great blog post. Of course, Joan Rivers just passed away, so part of the interest might be from the timeliness of the tweet. This is an art, not a science.
Another place to look for ideas is from the engagement/impressions numbers on links you share from other sites.
For example, I noticed in tweets from my own @corbettbarr account that links to my friend James Clear’s blog were more engaging than my average tweet:
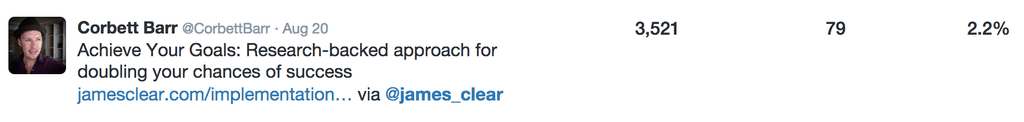
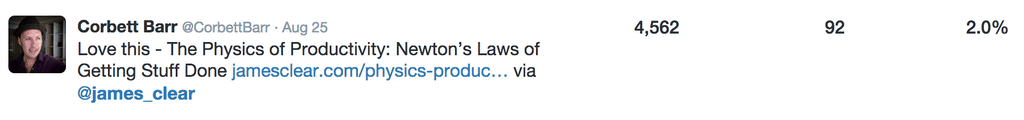
This tells me that my own followers are interested in the topics James writes about (and in his catchy headlines). Based on this, I should at least post more stuff from James, or perhaps I should write my own posts on similar topics.
Hopefully you’re getting the gist. By using Twitter’s analytics, you can short-circuit the process for finding great blogging/content ideas.
Use Twitter’s new analytics to short-circuit the process for finding great blogging/content ideas.
Tweet This or copy + Facebook
Post frequently, and try different thoughts, quotes and links to other sites. See how people react, and use those reactions to guide which content you create next. If you’re thinking about a specific idea, you could post several short soundbites to help figure out the right “hook” for your post, or even a specific headline.
No comments:
Post a Comment